Insights
Progress and health, drawn from the work itself: your week, a project's pulse, and every project at a glance.
Insights turns what the app already knows into pictures — nothing to set up, nothing to fill in. There are three views: your own week or month, a project's pulse, and every project at a glance. Each has a period picker at the top right: This week, This month or Last 90 days. Every chart has a small ⓘ that says what it shows and where the numbers come from, and Export PDF prints the page. For planning across people and projects see Workload and Portfolio.
Your week
Open Insights in the sidebar (or press g then s).
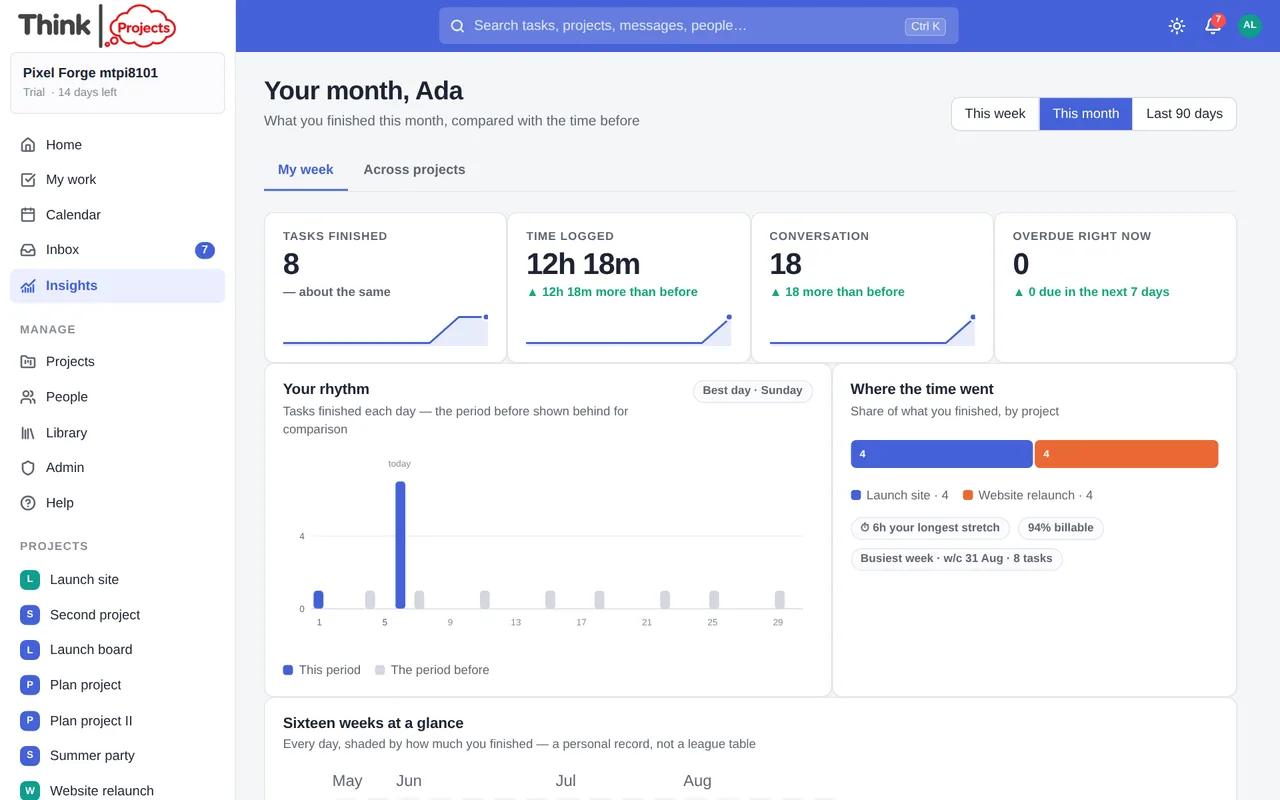
- Four tiles — tasks finished, time logged, conversation (messages, replies and comments) and what is overdue right now — each compared with the period before, with a small line showing the recent past day by day (the last four weeks for This week, twelve weeks for This month, twelve months for Last 90 days).
- Your rhythm — tasks finished each day, with the period before shown behind in grey. The best day chip picks out your strongest day.
- Where the time went — one bar showing the share of what you finished, by project.
- Sixteen weeks at a glance — every day shaded by how much you finished. It is a personal record for you, deliberately not a league table: nobody else's calendar is shown next to yours.
- A few chips for fun: a streak of days with something finished (weekends do not break it), your longest single stretch of logged time, the billable share, and your busiest week.
A project's pulse
Every project has an Insights tab, between Timeline and Files.
Health
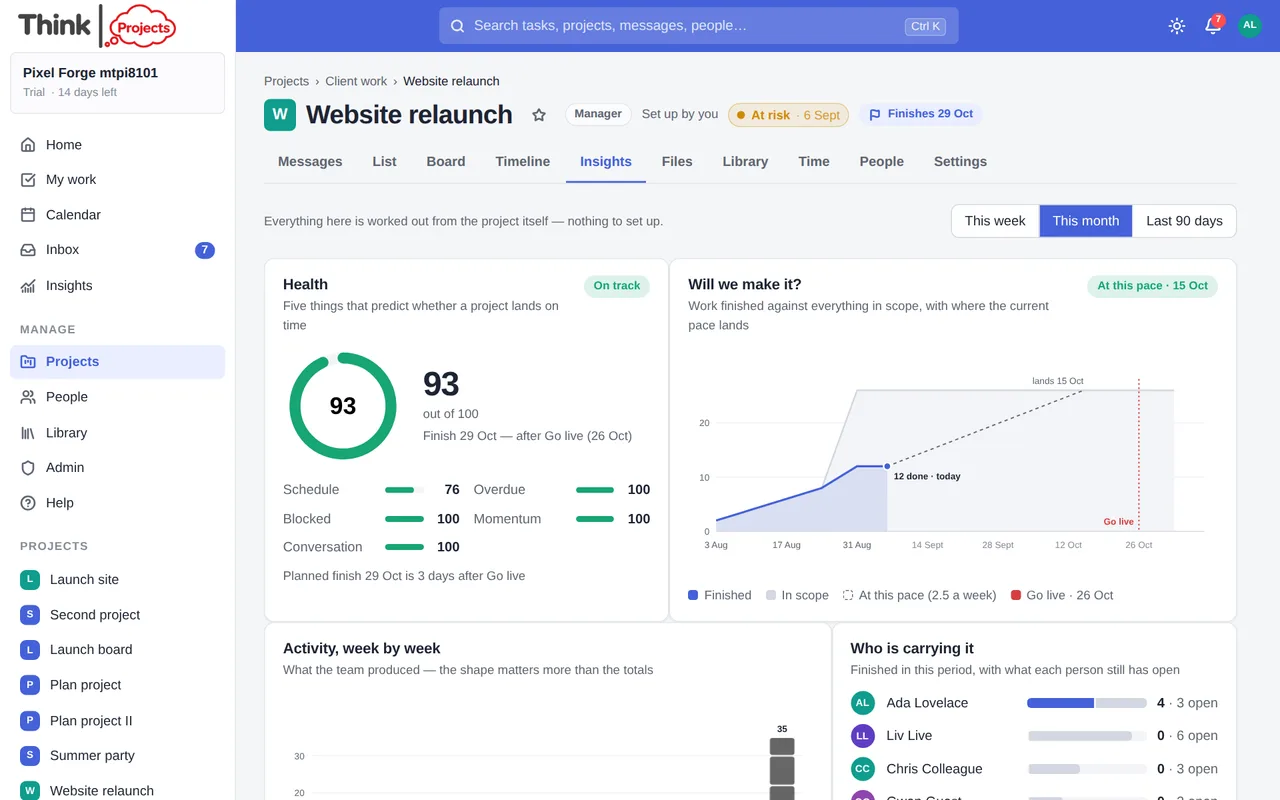
A score out of 100, with the five things it is made of shown as bars, so it is never a mystery. Hover any of them for the reason.
| Factor | What it measures |
|---|---|
| Schedule | The planned finish (from the timeline) against the milestone the project is measured by — a fixed milestone if there is one. Each day late costs points. |
| Overdue | The share of open tasks past their due date. |
| Blocked | Tasks that start before what they depend on can finish, tasks waiting on a late task, and tasks whose person is away. |
| Momentum | Tasks finished in the last seven days against the seven before. |
| Conversation | How recently anyone said anything on the project. |
The chip reads On track (75 and above), At risk (55–74) or Off track. A project with nothing finished and nothing said for six weeks reads Quiet instead — silence is its own signal. A factor that does not apply (no milestone to keep, for instance) is left out and the others count for more.
Will we make it?
The burn-up chart. The grey area is everything in scope (tasks in the project, week by week, from the day they were added); the blue area is what has been finished. The red dashed line is the milestone. From the pace of the last four weeks, a dotted line shows where the work lands — and the chip at the top says the date. If that date is after the milestone, the chip is amber; if nothing has been finished in four weeks there is no line to draw.
Activity, week by week
Stacked columns of what the team produced each week — tasks finished, tasks added, messages and replies, files and library items. The shape matters more than the totals: a project that goes quiet shows it here a month before it shows as late.
Who is carrying it
For each person on the project: finished in this period (blue) and still open (grey). It is about load, not ranking.
What is moving, what is stuck
Each list's progress bar, and how many of its tasks were finished in the last fortnight — the honest version of a status meeting.
Status, week by week
The colour of every weekly status update that was sent, oldest first. See Weekly status updates.
Open tasks by age
How long the open tasks have been waiting since they were added. The old ones are amber.
Across projects
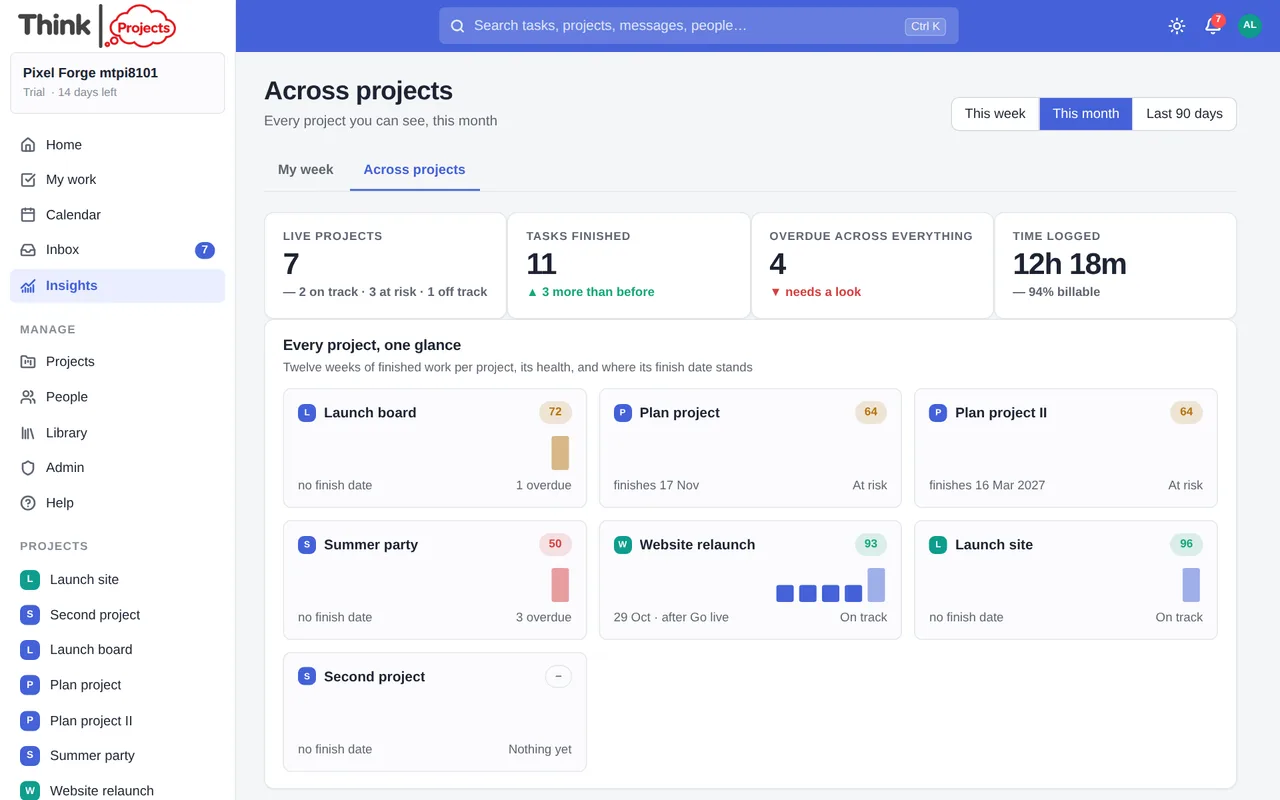
The second tab on the Insights page: four tiles for the organisation (live projects by health, tasks finished, overdue across everything, time logged with the billable share) and a card per project with twelve weeks of finished work, its health score, its finish date and where it stands against its milestone. Click a card to open that project's Insights tab. Guests see the projects they are on; members and administrators see every live project.
Where the numbers come from
Everything is computed from the project's own records — when tasks were added and finished, who finished them, messages and replies, time entries, milestones, dependencies and the planning engine. Dates are counted in your own time zone. Deleted tasks leave the history, which is what you would expect.
Want to try it on your own work? Every feature on every plan, a 14-day trial, no card needed — and guests are always free.
Create a workspace