Help guide · 13 of 26
Portfolio
Every live project on one line each: where the plan says it finishes, its milestones, and whether it needs a look.
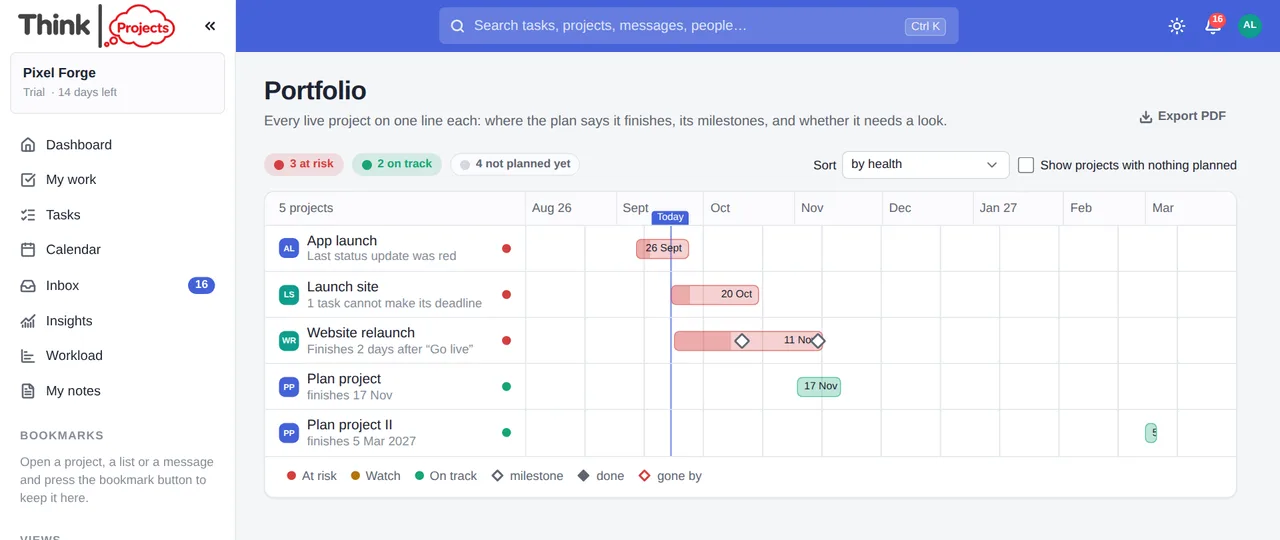
Portfolio in the sidebar (or g then o) is the Monday-morning picture: one row per project you can see, on a month scale with today marked, so the whole company's plan fits on one screen.
Each row
- A bar from the project's planned start to the day its plan says it finishes, with the finish date on the bar and the share of tasks done shaded inside. A dashed end means there is no finish yet — the open tasks have no dates or estimates.
- Diamonds for milestones: hollow to come, filled when done, red when the date has gone by without the milestone being ticked.
- A colour for health, with the reason in one line under the name — hover the bar for the full list.
Rows and diamonds open the project's Timeline.
What the colours mean
Health is worked out, never set by hand:
- Red — at risk: the forecast finish is already behind today, or lands after the last open milestone, or a task cannot make its hard deadline, or the last status update was red.
- Amber — watch: overdue tasks, a milestone gone by unticked, a task pinned before what it depends on, a task on someone's time off, or an amber status update.
- Green — on track: none of the above.
- Grey — not planned: no dated tasks and no milestones yet. These are hidden by default; tick Show projects with nothing planned to see them.
The chips at the top count projects in each state. Sort by health (red first), finish date, name, or the order on the Projects page. Export PDF prints the chart.
Want to try it on your own work? Every feature on every plan, a 14-day trial, no card needed — and guests are always free.
Create a workspace